


Investor Relations
Information to help investors gain a deeper insight into who we are
- HOME >
- Investor Relations >
- Overview >
- Dividend
Overview
We proactively return profits to shareholders while striving to enhance medium- to long-term value.
ROE is the most important financial indicator
We emphasize ROE, an indicator of earnings power, while aiming to take full advantage of shareholders’ equity.
Our ROE always exceeds TSE Prime Market average
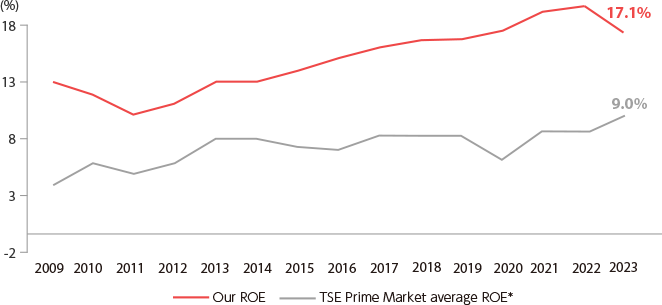
*Source: Mizuho Securities. Until FY2020:TSE 1st section average
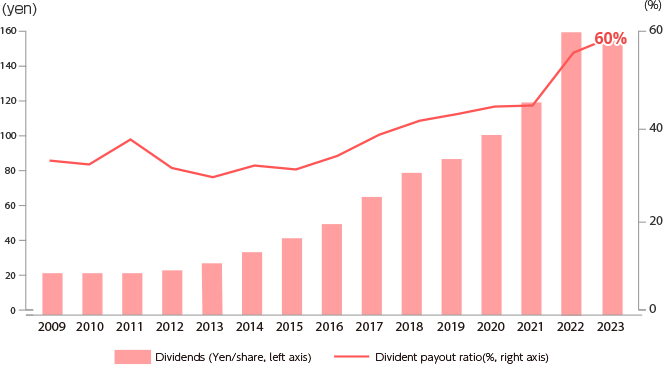
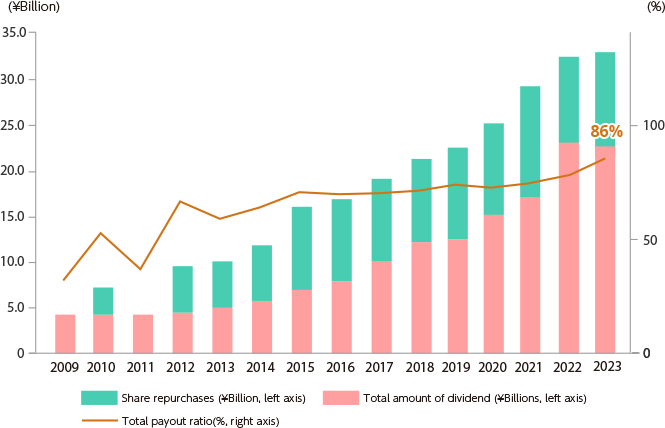
Aiming for dividend payout ratio of 55% or more and total payout ratio of 75% or more
Our dividend payout ratio has been gradually increasing from 30.7% in FY2015, and the result for FY2025 was 54.9%.
Regarding share repurchases, we have repurchased 145.5 billion yen (27.9% of shares issued) from FY2006 to FY2025.
In Medium-term Business Plan"Vista2027 StageⅡ", our targets of a dividend payout ratio and a total payout ratio are 55% or more and 75% or more respectively.
Medium-term Business Plan "Vista2027 StageⅡ" Financial Indicators
| FY2025 Actual |
FY2025-27 Target |
|
|---|---|---|
| Dividend payout ratio | 54.9% | 55% or more |
| Total payout ratio | 75.7% | 75% or more |
Details on Shareholders Return here
Glossary
- ROE (Return on equity) : Net income ÷ Shareholders’ equity
The ratio of net income to shareholders’ equity.
This ratio shows the extent to which shareholders’ equity was used to generate profits. - EPS (Earnings per share) : Net income ÷ Number of shares issued
This shows the amount of net profits per share. - Dividend payout ratio: Dividend payment amount ÷ Net income
This ratio shows the extent to which net income is returned to shareholders in the form of dividends. - Total payout ratio : (Dividend payment amount + Share share repurchases amount) ÷ Net income
This ratio shows the extent to which net income is returned to shareholders in the form of dividends and share repurchases.