


Sustainability
Continuous Improvement of Responsible Care Activities
- HOME >
- Sustainability >
- Continuous Improvement of Responsible Care Activities >
- Mitigation of Climate Change
Mitigation of Climate Change
Policy/Philosophy
Due to consumption of large amounts of fossil fuels such as oil and coal since the Industrial Revolution, greenhouse gas (GHG) emissions, including carbon dioxide emissions, are increasing and global warming is progressing. With the progression of climate change due to global warming, there is concern that various adverse effects on people's lives and the ecosystem will increase, such as increases in natural disasters including heavy rains and floods, reduction of food and water resources, and occurrences periods with intense heat and outbreaks of infectious diseases due to heat waves.
The Paris Agreement, which went into effect in 2016, aims to reduce the rise in average temperature well below 2°C (2°C target) as a long-term international goal in order to slow the progress of climate change and shift to a decarbonized society. In addition, it is stated that further efforts will be made to suppress the rise in average temperature up to 1.5°C. We support the Paris Agreement, position "mitigation of climate change" as one of the materiality factors, we have set a mid-term target (Scope1 + 2) of "reducing GHG emissions by at least 30% from FY2018 level by FY2027" aiming for achievement of carbon neutrality in 2050.
We also support the Japanese government's efforts to curb global warming, and comply with “Act on Promotion of Global Warming Countermeasures” and "Act on the Rational Use of Energy". In addition, we announced our support for recommendations of Task Force on Climate-related Financial Disclosures (TCFD).
In accordance with our Responsible Care Basic Policy, our Group will actively work to reduce greenhouse gases emissions in business activities and contribute to the mitigation of climate change through the provision of eco-friendly products and services.

System
Indicators
Greenhouse Gas Emissions (Scope 1+2)
| Indicator | Scope | Unit | FY2021 | FY2022 | FY2023 | FY2024 | Target (Year) |
|---|---|---|---|---|---|---|---|
| CO2 emissions from energy use | non-consolidated | 1000t -CO2e |
216 | 181 | 175 | 180 | - |
| CO2 emissions from non-energy use | non-consolidated | 1000t -CO2e |
29 | 25 | 23 | 27 | - |
| N2O | non-consolidated | 1000t -CO2e |
100 | 121 | 87 | 70 | - |
| Other GHG gases | non-consolidated | 1000t -CO2e |
0 | 0 | 0 | 0 | - |
| Total※1 | non-consolidated | 1000t -CO2e |
345 | 328 | 285 | 278 | 254 (2027) |
| Scope 1 | non-consolidated | 1000t -CO2e |
232 | 223 | 174 | 167 | - |
| Scope 2 (market based) | non-consolidated | 1000t -CO2e |
114 | 104 | 111 | 111 | - |
- 1 Due to rounding off figures, there are places where the sums for each item do not match the total.
Energy Consumption (Crude Oil Equivalent)
| Indicator | Scope | Unit | FY2021 | FY2022 | FY2023 | FY2024 |
|---|---|---|---|---|---|---|
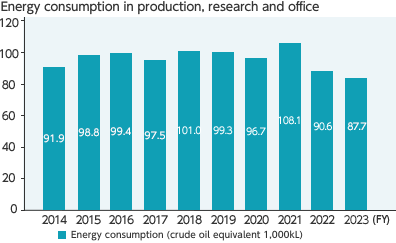
| Production, research and office | non-consolidated | 1000kL | 108.1 | 90.6 | 87.7 | 87.6 |
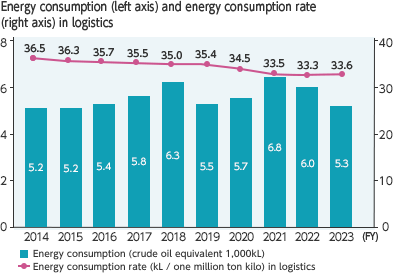
| Logistics | non-consolidated | 1000kL | 6.8 | 6.0 | 5.3 | 5.8 |
| Energy consumption rate | non-consolidated | kL / one million ton kilo | 33.5 | 33.3 | 33.6 | 32.7 |
Activities
Reduction of GHG Emissions (scope 1 + 2)
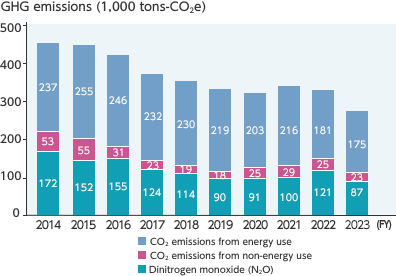
We set GHG emissions (Scope1 + 2) reduction target of “reducing by at least 30% from FY2018 level by FY2027” aiming for achievement of carbon neutrality in 2050.
As for GHG emissions, in accordance with the "Act on Promotion of Global Warming Countermeasures", we collect data on the emissions of carbon dioxide (CO2) and other GHG from all of our business establishments, including our plants, laboratories, and head office and submit this data to the national government. In addition, in order to examine the appropriateness of the calculation method, we have undergone a third-party verification since FY2018.
GHG emissions for FY2024 was 278,000 tons, decreased from 285,000 tons for FY2023.
Going forward, aiming to achieve FY2027 target, we will continue to consider various initiatives such as energy saving by upgrading to energy-efficient equipment and updating aging facilities, etc., emission reduction of nitrous oxide from nitric acid plants, fuel conversion, and CO2 fixation.
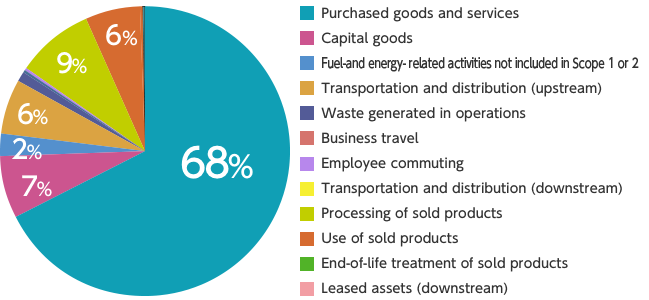
Understanding GHG Emissions through the Supply Chain (Scope 3)
We have calculated indirect GHG emissions (Scope 3) through the supply chain from raw material purchase to customer use and disposal. In addition, in order to examine the appropriateness of the calculation method, we have undergone a third-party verification, and in FY2024, category 1 and 10 were verified.
Scope 3 of FY2024 was calculated and found to be accounted for 68% by purchased products and services (Category 1).
We have participated in the Ministry of the Environment Green Value Chain Platform, and the status of Scope 3 calculation is also disclosed at https://www.env.go.jp/earth/ondanka/supply_chain/gvc/en/accounting_information.html
| No. | Item | Calculation method | Calculated value (tCO2e) | |
|---|---|---|---|---|
| Activity data | Emission factor | |||
| 1 | Purchased goods and services | Items and money amounts of all purchased goods and services | SC-DB※1 [5] Emission rate based on inter-industry relations table | 637,059 |
| 2 | Capital goods | Capital expenditure | SC-DB [6] Emission rate for prices of capital goods | 65,493 |
| 3 | Fuel-and energy- related activities not included in Scope 1 or 2 | Procurement volume for each category of energy | SC-DB [7] Emission rate of electricity and energy use, and IDEAv2※2 | 22,400 |
| 4 | Transportation and distribution (upstream) | Act on the Rational Use of Energy Specified Shipper’s Data and ton-kilometer of weight of the products purchased | Emission rate under Act on the Rational Use of Energy, emission rate for energy consumption by improved ton-kilometer method, and IDEAv2 | 63,212 |
| 5 | Waste generated in operations | Disposed amounts for each category of wastes | SC-DB [9] Emission rate for each category of wastes | 13,343 |
| 6 | Business travel | Amount of payments for traffic expenses | SC-DB [11] Emission rate for traffic expenses paid | 2,939 |
| 7 | Employee commuting | Number of employees and number of working days | SC-DB [14] Emission rate for number of employees and for number of working days | 903 |
| 8 | Leased assets (upstream) | - | - | Included in Scope 1 or 2 |
| 9 | Transportation and distribution (downstream) | Weight of sold agrochemical product | IDEAv2 | 1,937 |
| 10 | Processing of sold products | GHG emission data at main customers and Sales amount | - | 78,481 |
| 11 | Use of sold products | Sales amount of GHG products | - | 49,834 |
| 12 | End-of-life treatment of sold products | Container weights data responding to Containers and Packaging Recycling Act, and sales amount of products | SC-DB [9] Emission rate for each category of wastes | 3,584 |
| 13 | Leased assets (downstream) | Area of rental buildings | SC-DB [16] Emission rate for each use of buildings | 59 |
| 14 | Franchises | - | - | No applicable |
| 15 | Investments | - | - | No applicable |
- 1 SC-DB : Database of Emissions Unit Values for Accounting of Greenhouse Gas Emissions, etc., by Organizations Throughout the Supply Chain (Ver.3.4)
- 2 IDEAv2:Inventory Database for Environmental Analysis ver2.3 (for accounting supply chain GHG emissions)
Initiatives to Reduce Energy Consumption (Production, research and office)
In accordance with the "Act on the Rational Use of Energy", we collect data on the amount of energy consumed at all of our business establishments and submit this data to the national government, along with data on our energy consumption rate. Our energy consumption (crude oil equivalent) in FY2024 decreased by 0.14% compared to that of previous fiscal year.
Initiatives to Reduce Energy Consumption (Logistics)
As a cargo owner, we work together with Nissan Butsuryu Co., Ltd., a group company which handles our logistics operations, to promote the rational use of energy for transportation. In FY2024, the amount of energy consumption in crude oil equivalent increased from the previous fiscal year. The energy consumption rate was the same as the previous fiscal year.
We have received the Eco Rail Mark certification in 2018, and we will continue striving to improve our energy consumption rate through measures such as promoting modal shifts, replacing vehicles with energy-saving and practicing eco-driving.
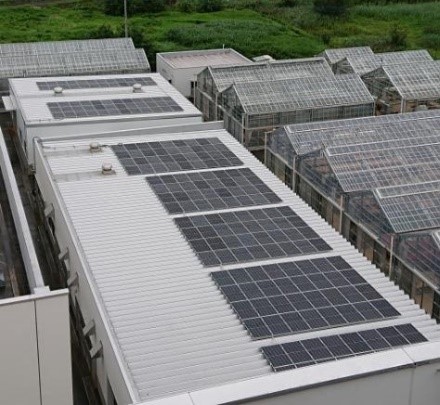
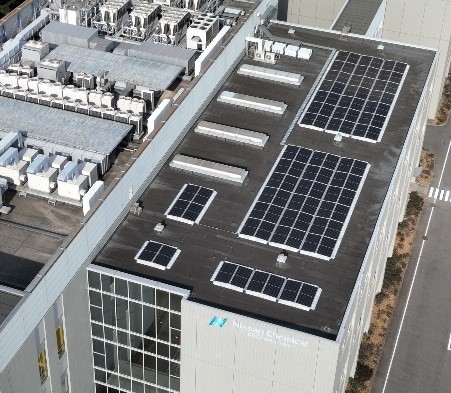
TOPICS:Introduction of Solar-power Generation System
As part of our efforts to reduce greenhouse gas (GHG) emissions, we have installed solar power generation systems at the following business sites. We will continue to promote our efforts to reduce GHG emissions.
Biological Research Laboratories
In October 2020, in response to Saitama Prefecture Global Warming Strategy Promoting Ordinance, we introduced self-consumed solar-power generation system at the biological research laboratories. Solar panels are installed on the roofs of the research buildings, which is expected to reduce greenhouse gas emissions by approximately 70 tons-CO2 per year. We will continue to promote our efforts to reduce GHG emissions.
Materials Research Laboratories
In December 2024, we introduced self-consumed solar-power generation system at the materials research laboratories. Solar panels are installed on the roofs of the research buildings. The solar-power generation system is expected to generate approximately 21 kWh of electricity per year and reduce GHG emissions by approximately xx tons-CO2 per year.
Response to the revised Act on Rational Use and Proper Management of Fluorocarbons
Fluorocarbons are refrigerants used in air conditioners, refrigerators, and similar equipment, with hydrofluorocarbons (HFCs) -compounds of carbon, hydrogen, and fluorine- being the primary type. While fluorocarbons are widely utilized in both households and industries because of their usefulness, they pose a serious environmental concern due to their global warming potential, which is estimated to be 100 to 10,000 times greater than that of carbon dioxide. As a result, further efforts to replace fluorocarbons and reduce their emissions are urgently needed.
In this context, the Kigali Amendment to the Montreal Protocol on Substances that Deplete the Ozone Layer was adopted in 2016 and came into effect in January 2019.
In Japan, the Act on Rational Use and Proper Management of Fluorocarbons was enacted in April 2015 following revisions of the Fluorocarbon Recovery and Destruction Law. This legislation mandates the monitoring of the amount of fluorocarbon leakage and requires entities that exceed a certain leakage threshold to report to the government. Furthermore, the revised Act on Rational Use and Proper Management of Fluorocarbons, effective from April 2020, introduced direct penalties for users who fail to recover fluorocarbons properly.
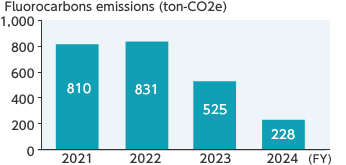
In FY2024, the amount of fluorocarbons leaked from our domestic facilities was approximately 228 tons-CO₂e (Entities - either a single facility or an entire company- that leak 1,000 tons-CO2e or more are required to report to the government).
We remain committed to ongoing legal compliance and will continue to proactively work toward reducing emissions of leaked fluorocarbons.
Involvement with Industry Associations
Keidanren’s "Carbon Neutral Action Plan"
As a member of JCIA, we participate in the "Carbon Neutral Action Plan" of the Japan Business Federation (Keidanren).
METI's “GX League”
We expressed its support for the GX (Green Transformations) League Basic Concept, which was announced by the Ministry of Economy, Trade and Industry (METI) in February 2022, and have been participating in the GX League since April 2023.
The GX League is designed to bring together companies actively engaged in GX to discuss the transformation of the entire economic and social system and practice initiatives to create new markets, together with players in government, academia, and finance that are tackling challenges to achieve GX.