

Sustainability
Continuous Improvement of Responsible Care Activities
- HOME >
- Sustainability >
- Continuous Improvement of Responsible Care Activities >
- Reduction of Industrial Waste and Pollutant Emissions
Reduction of Industrial Waste and Pollutant Emissions
Policy/Philosophy
With the development of socio-economics, there is a call to move away from the "mass production, mass consumption, mass disposal" system and reduce resource consumption by promoting efficient use and recycling of substances from production to distribution, consumption, and disposal to form a “recycling society” which will have less impact on the environment.
Therefore, our Group is further promoting the 3Rs (Reduce, Reuse, Recycle) through responsible care activities, striving to reduce waste and make effective use of it.
Furthermore, with regard to the emission of chemical substances generated by production activities into the atmosphere, waters, and soil, appropriate management shall be conducted to comply with emission standards set forth by various laws and regulations as well as regulatory values based on local agreements to reduce the burden on people's health and the environment.
System
Indicators
Waste
| Indicator | Scope | Unit | FY2021 | FY2022 | FY2023 | FY2024 |
|---|---|---|---|---|---|---|
| Volume of waste generation | non-consolidated | 1000tons | 38.2 | 39.6 | 30.1 | 27.1 |
| Recycled volume | non-consolidated | 1000tons | 7.1 | 8.1 | 6.8 | 5.9 |
| Final disposal volume | non-consolidated | 1000tons | 1.2 | 5.7 | 4.9 | 1.4 |
| Final disposal ratio※1 | non-consolidated | % | 6.0 | 22.6 | 22.8 | 8.5 |
- 1 Final disposal volume / Volume of waste discharged outside x 100
Waste (Excluding waste soil)
| Indicator | Scope | Unit | FY2021 | FY2022 | FY2023 | FY2024 | Target (Year) |
|---|---|---|---|---|---|---|---|
| Volume of waste generation | non-consolidated | 1000tons | 37.8 | 32.5 | 24.6 | 26.2 | - |
| Recycled volume | non-consolidated | 1000tons | 7.1 | 6.0 | 5.6 | 5.9 | - |
| Final disposal volume | non-consolidated | 1000tons | 0.83 | 0.63 | 0.49 | 0.49 | 0.41 |
| Final disposal ratio※1 | non-consolidated | % | 4.2 | 3.4 | 3.1 | 3.1 | - |
- 1 Final disposal volume / Volume of waste discharged outside x 100
Plastic Waste
| Indicator | Scope | Unit | FY2021 | FY2022 | FY2023 | FY2024 | Target (Year) |
|---|---|---|---|---|---|---|---|
| Amount of plastic waste | non-consolidated | ton | 795 | 830 | 592 | 656 | - |
| Recycling rate of plastic waste | non-consolidated | % | 44 | 55 | 53 | 57 | 50 (2027) |
Emissions to Atmosphere
| Indicator | Scope | Unit | FY2021 | FY2022 | FY2023 | FY2024 |
|---|---|---|---|---|---|---|
| Volatile organic compounds (VOCs)※ | non-consolidated | ton | 0.5 | 0.5 | 2.7 | 3.5 |
| NOx | non-consolidated | ton | 113 | 96 | 63 | 72 |
| SOx | non-consolidated | ton | 28 | 19 | 23 | 29 |
| Dust | non-consolidated | ton | 10 | 7 | 8 | 10 |
- Including other than benzene and formaldehyde
Control of Waste Water
| Indicator | Scope | Unit | FY2021 | FY2022 | FY2023 | FY2024 |
|---|---|---|---|---|---|---|
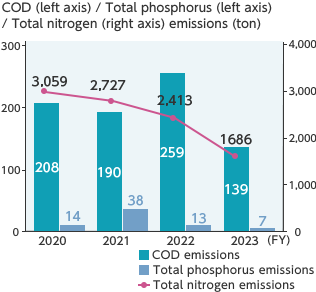
| COD emissions | non-consolidated | ton | 190 | 259 | 139 | 160 |
| Total phosphorus emissions | non-consolidated | ton | 38 | 13 | 7 | 19 |
| Total nitrogen emissions | non-consolidated | ton | 2,727 | 2,413 | 1,686 | 2,596 |
PRTR Substances
| Indicator | Scope | Unit | FY2021 | FY2022 | FY2023 | FY2024 | |
|---|---|---|---|---|---|---|---|
| Emissions of PRTR Substances |
Atmosphere | non-consolidated | ton | 0.5 | 1.3 | 2.7 | 3.5 |
| Waters | non-consolidated | ton | 0.5 | 0.4 | 0.4 | 0.14 | |
| Soil | non-consolidated | ton | 0 | 0 | 0 | 0 | |
| Total※ | non-consolidated | ton | 0.9 | 1.7 | 3.0 | 3.6 | |
- Due to rounding off figures, there are places where the sums for each item do not match the total.
Activities
Reduction of Waste
We thoroughly implement control measures to ensure the proper disposal of waste, while also are striving to reduce industrial waste. We also applied electronic manifests using legal compliance system for waste.
Waste water discharged in the manufacturing process accounts for the majority of our industrial waste. We treat this waste internally by means of combustion.
Although the volume of waste generation in FY2024 increased compared to FY2023, it was the second lowest in the past five years.
Regarding final disposal volume, we have set a new FY2027 target of "reducing by 50% or more compared to FY2021." The final disposal volume in FY2024 was 494 tons, a 40% reduction compared to FY2021.
![Waste volume [1,000 tons]](image/management_img03.png)
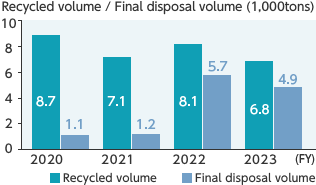
- We have revised our data aggregation method to exclude waste soil from plants. The figures shown reflect this revised approach.
Efforts for Emission Reduction and Recycle of Plastic Waste
Based on the enforcement of the Act on Promotion of Resource Circulation for Plastics (effective date: April 1, 2022), we have disclose information on plastic waste as a large- amount waste-discharging enterprise※. In addition, we have promoted efforts for emission reduction and recycle of plastic waste.
Although the amount of plastic waste in FY2024 slightly increased compared to FY2023, by the efforts such as recycling at plants and research laboratories, the recycling rate increased to 57%, achieving the FY2027 target of 50% for the three consecutive years. Going forward, we will continue to promote initiatives such as recycling.
| Amount of plastic waste |
Recycling rate of plastic waste |
|
|---|---|---|
| FY2021 | 795t | 44% |
| FY2022 | 830t | 55% |
| FY2023 | 592t | 53% |
| FY2024 | 656t | 57% |
- Waste-discharging enterprise that generate 250 tons or more of plastic waste
Reduction of Emissions of VOCs
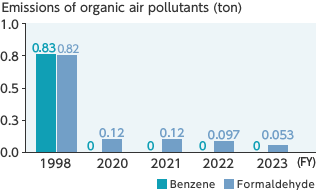
We regularly take initiatives to reduce emissions of volatile organic compounds (VOCs), which cause the formation of photochemical oxidants. Among the twelve substances of VOCs which were selected, formulated voluntary management plan, and worked on reduction by chemical industry, three (1,2-dichloroethane, benzene, and formaldehyde) were handled in the Company. As a result of measures such as the introduction of VOC removal equipment, emissions of these have been significantly reduced. Especially, emissions of benzene have been eliminated since FY2017 due to the conversion of naphtha to natural gas as a fuel and feedstock. We are also reducing emissions of formaldehyde through measures such as sealing facilities and combustion treatment of exhaust gases.
Control of Exhaust Gas
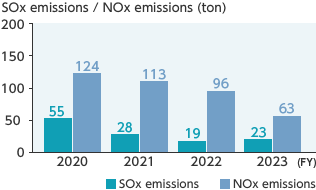
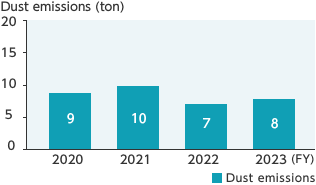
We control exhaust gas by observing the discharge standards in the "Air Pollution Control Act" and regulatory values based on agreements with local communities. We maintain the proper conditions in our desulfurization facilities and denitrification facilities in an effort to control the emissions of air pollutants such as sulfur oxide (SOx) and nitrogen oxide (NOx). Since FY2017, the conversion of boiler fuel to natural gas has resulted in significant reduction in SOx emissions and dust emissions.
Control of Waste Water
Our plants observe the discharge standards stipulated in the "Water Pollution Control Act" and regulatory values based on agreements with local communities. In addition, at the Onoda Plant, we have been taking measures to maintain the quality of waste water discharged from the plant in line with the "Act on Special Measures concerning Conservation of the Environment of the Seto Inland Sea". We monitor the chemical oxygen demand (COD), the total nitrogen and total phosphorus concentration in waste water of each plant on a regular basis and work to reduce these emissions.
Reduction of Emissions of PRTR Substances
Every year, we use 50~60 chemical substances whose emissions must be registered in accordance with the “Act on Confirmation, etc. of Release Amounts of Specific Chemical Substances in the Environment and Promotion of Improvements to the Management Thereof (PRTR law)”. The main substances emitted were formaldehyde and n-hexane, which are used as a reaction solvent.
In FY2024, total volume of emissions was 3.6 tons, including 3.5 tons to the atmosphere and 0.1 tons to the waters. Since we significantly reduced emissions into the atmosphere in FY2017, we have maintained the emission amount into the atmosphere.
We will continue to take steps to control the emissions. We did not emit these substances into the soil.
![Emissions of PRTR substances [ton]](image/management_img06.png)
![Breakdown of emissions of PRTR substances [ton]](image/management_img07.png)