


Sustainability
Sustainability
- HOME >
- Sustainability >
- Sustainability >
- Information Disclosure in Line with TCFD and TNFD Recommendations
Information Disclosure in Line with TCFD and TNFD Recommendations
Strategy of Natural Capital (Update:July 2024)
We have employed the LEAP approach recommended by TNFD as an integrated analytical approach for natural capital-related evaluation. The LEAP approach consists of four phases: Locate (The interfaces with nature), Evaluate (Dependencies and impacts on nature), Assess (Nature-related risks and opportunities), and Prepare (To respond and report).
Scope and Period of Analysis
- ●Scope of Analysis:Agrochemicals in the Agricultural Chemicals business
(Some of the risks/opportunities cover other businesses) - ●Period of Analysis:2030 and 2050
Analysis Process Based on the LEAP Approach
Locate: Identify priority areas
We analyzed and assessed specific areas related to the Group’s business activities using tools like the WWF Biodiversity Risk Filter to locate interfaces between the Company and nature and identify our priority areas.
As agrochemicals use petroleum, natural gas, and various minerals as raw materials, the Company manufactures finished products through materials extracting and processing and the production of intermediate products. In light of Japan’s import conditions and the world’s reserves of those resources, the value chain (VC) upstream (extracting and processing raw materials) is considered to have been mostly carried out in overseas countries, such as Saudi Arabia, the UAE, Australia, China, Canada, and Peru. Accordingly, we find it difficult to locate specific oil and gas fields, minerals, and processing plants; however, some locations are highly likely to correspond to the priority areas.
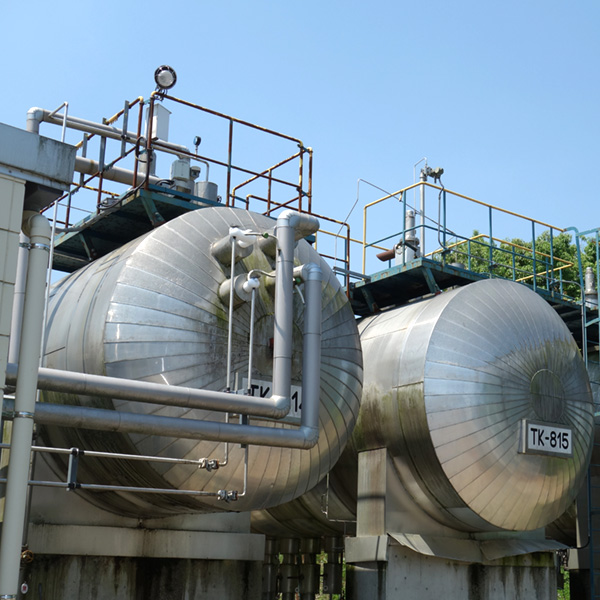
The Company manufactures agricultural chemicals at the Onoda Plant, the Saitama Plant, and the plants of NC Agro Hakodate Corporation and Nissan Bharat Rasayan PVT. LTD. (India). Considering our business activities’ dependencies and impacts on nature, we recognize the importance of the “Sensitive Locations” criteria defined in TNFD. Therefore, we have identified the following locations as our priority areas.
| Name of Bases | Sensitive Locations | |||
|---|---|---|---|---|
| Ecosystem Integrity | Biodiversity Importance | Physical Water Stress | Importance of Providing Ecosystem Service | |
| Saitama Plant | The ecosystem integrity has not declined. | As it is away from the protected areas, biodiversity importance is low. | Flood risk is high | No case of infringement on the rights of indigenous peoples/communities |
| Onoda Plant | As it is near the protected areas, biodiversity importance is high. | |||
| NC Agro Hakodate Corporation | Flood risk is moderate. | |||
| Nissan Bharat Rasayan PVT. LTD. | As it is away from the protected areas, biodiversity importance is low. | The water quality risk is very high. Water scarcity risk/flood risk is high. |
||
Tools used: WWF Risk Filter Suite、Global Forest Watch map
Evaluate: Identify and evaluate nature-related dependencies and impacts
The value chain of agricultural chemicals comprises materials sourcing and processing, production of intermediate products, manufacturing of finished products by the Company, and the use of products in agriculture. Employing ENCORE*, we identified and evaluated each process’s nature-related dependencies and impacts to prepare a heatmap, as shown below.
- ENCORE(Exploring Natural Capital Opportunities, Risk ad Exposure)
ENCORE is a tool jointly developed by the Natural Capital Finance Alliance (NCFA), an international network of financial institutions, and the United Nations Environment Programe World Conservation Monitoring Center (UNEP-WCMC). Using this tool, companies can explore dependencies and impacts on nature by each sector, sub-industry, and production process (under GICS or the Global Industry Classification Standard).
| Process | Raw Materials | Dependencies | ||||||||||||
|---|---|---|---|---|---|---|---|---|---|---|---|---|---|---|
| Provisioning Services | Regulation & Maintenance Services | |||||||||||||
| Production Process | Mitigates Direct Impacts | Protection from Disruption | ||||||||||||
| Groundwater | Surface water | Ventilation※1 | Water flow maintenance | Water quality | Decompose of pollutant | Dilution by air and water | Filtration※2 | Alleviation of noise and light pollution | Climate regulation※3 | Floods and Storms | Soil erosion | |||
| Up-stream | Extract raw materials | Petroleum/natural gas | ||||||||||||
| Minerals | ||||||||||||||
| Process raw materials | Petroleum/natural gas | |||||||||||||
| Minerals | ||||||||||||||
| Produce intermediate products | ||||||||||||||
| Direct Operations | Manufacture agricultural chemicals | |||||||||||||
| Down-stream | Use of agricultural chemicals | |||||||||||||
Legends:
very high,
high,
moderate,
low,
very low.
Tool used: ENCORE
- 1 Ventilation:Ventilation provided by natural or planted vegetation that is vital for good indoor air quality
- 2 Filtration:Filtration, sequestration, storage, and accumulation of pollutants by plants, animals, algae
- 3 Climate regulation:Long-term storage of carbon dioxide in soils, oceans, etc., and regulation of temperature, humidity, wind speed, etc., by vegetation
| Process | Raw Materials | Impacts | ||||||||||
|---|---|---|---|---|---|---|---|---|---|---|---|---|
| Water use | Use of terrestrial ecosystem | Use of freshwater ecosystem | Use of marine ecosystem | GHG emissions | Air pollutant | Water pollution | Soil pollution | Solid waste | Noise and light pollution, etc. | |||
| Up-stream | Extract raw materials | Petroleum/natural gas | ||||||||||
| Minerals | ||||||||||||
| Process raw materials | Petroleum/natural gas | |||||||||||
| Minerals | ||||||||||||
| Produce intermediate products | ||||||||||||
| Direct Operations | Manufacture agricultural chemicals | |||||||||||
| Down-stream | Use of agricultural chemicals | |||||||||||
Legends:
very high,
high,
moderate,
low,
very low.
Tool used: ENCORE
<Summary of identification and evaluation of nature-related dependencies and impacts>
- In the value chain upstream (particularly in the materials sourcing process), the dependencies on groundwater, surface water, water cycle, water quality, climate regulation, and protection from floods and storms are relatively high.
- In the process of manufacturing by the Company, the dependencies on ecosystem services are low.
- Through the entire value chain, the impacts on water use, GHG emissions, air, water, and soil pollution are high.
- In the value chain upstream, the impacts on water use and the use of terrestrial/freshwater/marine ecosystems are very high.
Assess: Identify and assess risks and opportunities
Taking into consideration our priority areas identified in the “Locate” phase and the dependencies and impacts identified and evaluated in the “Evaluate” phase, we identified and assessed nature-related risks and opportunities projected to affect the Company’s businesses.
| Social changes | Factors | Value Chain | Risk/ Opportunity |
Relevant Business | Impact on Business | Impact | |
|---|---|---|---|---|---|---|---|
| FY2030 | FY2050 | ||||||
Enhancement of our company initiatives and regulations for environmental conservation (transition) |
Enhancement of nature-related regulations | Upstream | Risk | All | Increase in raw materials procurement costs due to tightening environmental laws and regulations for materials sourcing, processing, and production of intermediate products. | High | High |
| Direct Operations | Increase in operation costs in our plants due to the enforcement of regulations on pollution. | Mid | High | ||||
| Increase in operation costs due to the introduction of tax on plastics; Generation of additional costs for replacing production equipment and switching packaging materials by introducing biomass plastics and other recyclable materials. |
Mid | High | |||||
| Growth of demand from investors and others seeking initiatives for nature-related issues | Direct Operations | Risk | All | Declines in the ESG rating, the Group’s reputation, the market capitalization and difficulty in financing due to the delay in countermeasures against climate change, such as the massive use of fossil-derived raw materials. | High | High | |
| Opportunity | Rises in the ESG rating, the Group’s reputation, and the market capitalization through progressive approaches and information disclosure. | High | High | ||||
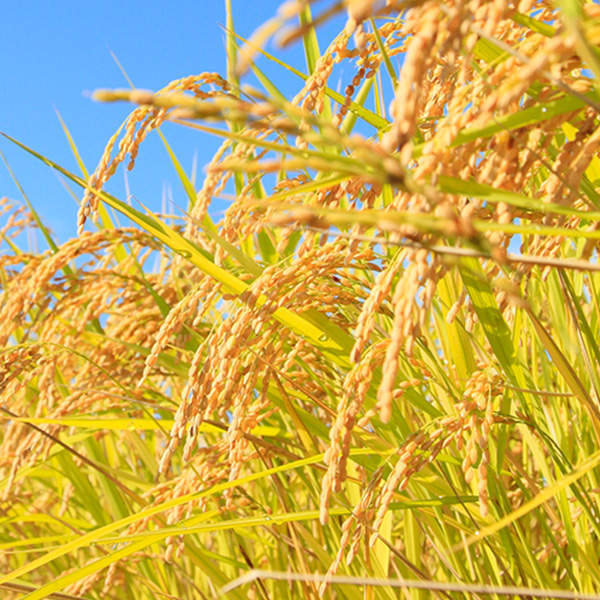
| Downstream | Risk | Agri | Reputational risk related to product safety | Mid | Mid | ||
| Market changes due to increasing demand for environmental consideration | Downstream | Risk | Agri | Decline in agrochemicals’ sales by introducing regulations on the use volume of agrochemicals. | High | High | |
| Reduction of the use volume and decline in sales of agrochemicals due to the expansion of organic beverage and food markets. | High | High | |||||
| Reduction of the use volume and decline in sales of agrochemicals by using various technologies, such as big data, drones, and farm management software. | High | High | |||||
| Opportunity | Growth of demand for biological agrochemicals; increase in opportunities to develop new agrochemical products. | Mid | High | ||||
| Increase in sales of new agrochemicals that adapt to Smart Agriculture (such as drone agrochemicals spraying*) * It contributes to the reduction of the use volume of agrochemicals. |
High | High | |||||
| Increase in sales of agrochemicals* for agricultural products in countries and territories where farming lands are being expanded for food production due to population growth. (*Those products that contribute to the prevention of farmland expansion by improving yields and environmentally friendly.) | High | High | |||||
| Increase in sales of agricultural business other than agrochemicals, such as investments into agriculture-related technologies development for Smart Agriculture and breed improvement. | Mid | Mid | |||||
Transition・Physical |
Market changes due to degradation of ecosystem services and increasing demand for environmental consideration | Upstream | Opportunity | All | Increase in sales of low-carbon products by switching to biomass-derived raw materials | Mid | High |
Environmental degradation・Rising temperatures (physical) |
Degradation of ecosystem services | Upstream | Risk | All | Increase in raw materials procurement costs due to water scarcity, floods, or similar risks in materials sourcing and processing and production of intermediate products; Supply shortage of those materials due to the suspension of or limitation to production. |
High | High |
| Direct Operations | Agri | Decline in production capacity (such as shortage of cooling capacity) and increase in products/materials management costs due to water scarcity caused by drought and heat waves | Low | Low | |||
| Market changes due to degradation of ecosystem services | Downstream | Risk | Agri | Reduction of planted area due to increase in frequency and intensity of storms/floods and difficulties in securing irrigation water. Changes in the distribution of planting and reduction in planted area due to temperature rise. |
Low | Low | |
| Opportunity | Increase in existing products’ sales and opportunities for the development of new agrochemicals due to the spread of pest insects, weeds, and pathogens and the development of their resistance. | High | High | ||||
All: All business・Planning and Development Division, Agri: Agricultural Chemicals business
<Scenario Analysis>
On analysis, referring to the TNFD guidance, we prepared the figure below to project future nature-related outcomes in four (4) scenarios. The chart’s vertical axis shows the degree of degradation of ecosystem services (environment) in the cases of the less degraded 1.5°C scenario and the more degraded 4°C scenario (in terms of climate changes), indicating physical risks and opportunities. The horizontal axis shows the stringentness of enhancing regulations and the growth of the market need for environmental conservation, indicating transition risks and opportunities.
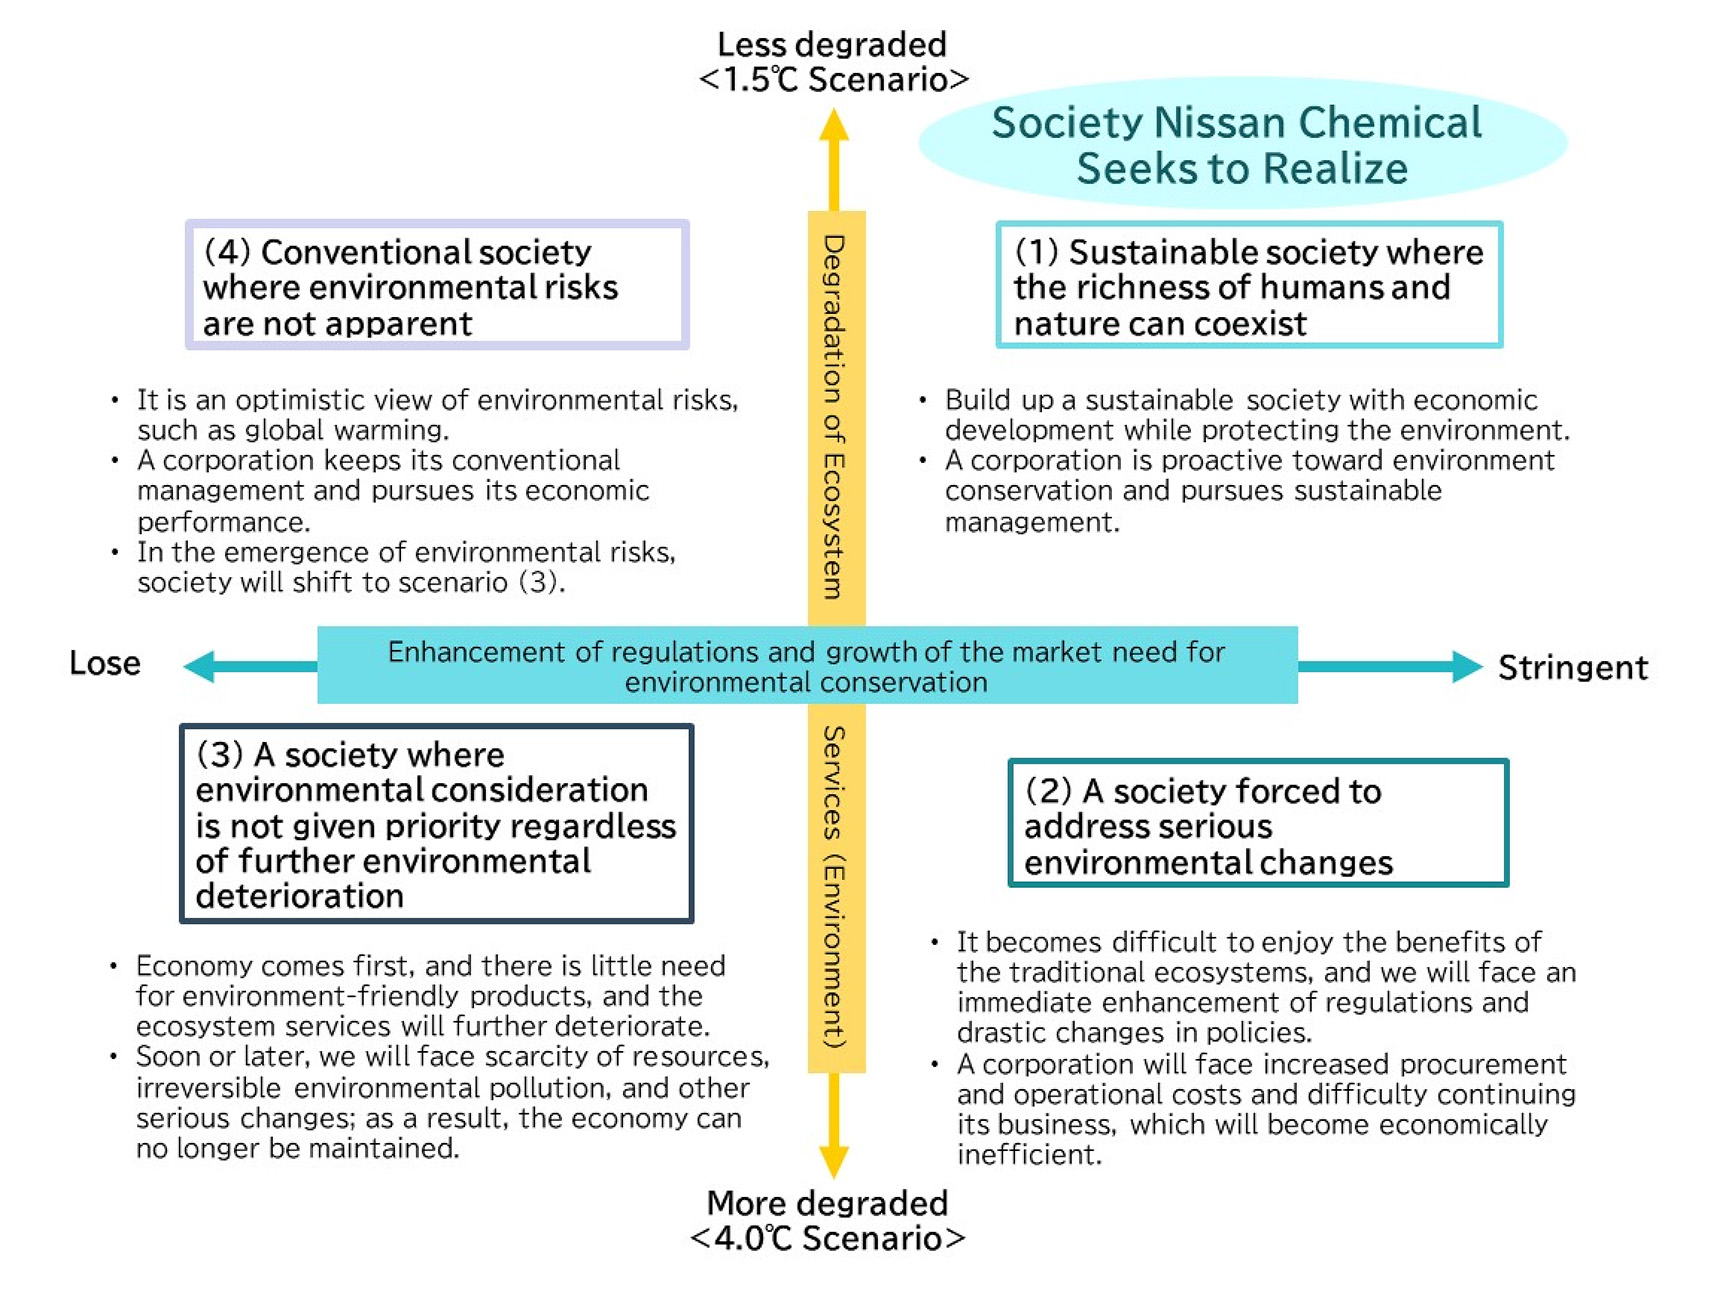
- ●Referenced Scenarios
| 1.5°C Scenario*1 | 4°C Scenario*2 |
|---|---|
| ・IEA-WEO*3, ETP*4 Net Zero Scenario (NZE) ・IPCC SSP*5 1-1.9, 1-2.6 |
・IEA-WEO Stated Policies Scenario (STEPS) ・IPCC SSP5-8.5 |
- *1The scenario where necessary measures are implemented to keep the increase in global average temperature below 1.5°C above pre-industrial levels.
- *2The scenario where the global average temperature increases by 4°C above the pre-industrial levels at the end of the 21st century.
- *3International Energy Agency “World Energy Outlook” (2022)
- *4International Energy Agency “Energy Technology Perspectives” (2023)
- *5Intergovernmental Panel on Climate Change (IPCC) “Shared Socio-economic Pathway”
Scenario(1):Sustainable society where the richness of humans and nature can coexist
It is a society that the Company/Group aims for. We will pursue sustainable management to enable our businesses to continue while preserving the environment. In the Agricultural Chemicals business, we have set our goals, “the stable supply of foods” and “sustainable agriculture,” based on the long-term management plan “Atelier2050.”
Scenario(2):A society forced to address serious environmental changes
As future changes in natural capital are uncertain, there is a probability that the degradation of ecosystem services will not be curbed, and people will have to face an immediate tightening of regulations and drastic changes in policies.
Scenario(3):A society where environmental consideration is not given priority regardless of further environmental deterioration
There is a probability that even though ecosystem services are further degraded, environmental regulations will not be enhanced without change in the market; thereby, the ecosystem services will seriously deteriorate. As a result, society will suffer substantial damage to economic activities.
Scenario(4):Conventional society where environmental risks are not apparent
As future changes in natural capital are uncertain, there is also a probability that ecosystem services will not deteriorate till 2030, and social conditions will not change as much as anticipated. However, it is certain that the loss of biodiversity and environmental changes, such as climate change, will advance gradually, and environmental risks are considered to become evident by 2050 in the long view. In that case, society will likely shift to it in scenarios (2) or (3); therefore, we will take countermeasures for risks and opportunities as described in (2) and (3).
<High-impact risks/opportunities and countermeasures>
| Impact on the Company | Countermeasures | Related Scenarios | |
|---|---|---|---|
High-impact Risks |
Increase in raw materials procurement costs due to tightening environmental laws and regulations for materials sourcing, processing, and production of intermediate products. | ・Price pass-through to products ・Multiple sourcing of several key raw materials |
(1)(2) |
| ・Switch the suppliers to those who use biomass-derived raw materials ・Develop products that use biomass-derived raw materials |
(2) | ||
| Increase in operation costs in our plants due to the enforcement of regulations on pollution. | ・Changes to equipment and manufacturing processes in line with enhancement of regulations ・Distribute facility investment methodically to maintain regulatory compliance as the strengthened regulatory requirements are determined ・Check the trends of tightening regulations in RC (Responsive Care) management activities. |
(2) | |
| Increase in operation costs due to the introduction of tax on plastics; Generation of additional costs for replacing production equipment and switching packaging materials by introducing biomass plastics and other recyclable materials. |
・Reduce the use of plastics for containers and packages ・Switch containers/packages materials from fossil-derived plastics to biomass-derived and other recyclable materials |
(2) | |
| Declines in the ESG rating, the Group’s reputation, the market capitalization and difficulty in financing due to the delay in countermeasures against climate change, such as the massive use of fossil-derived raw materials. | ・Enhance RC management ・Enhance initiatives for reducing environmental impacts ・Develop environmentally friendly agrochemicals and promote their sales ・Appropriate information disclosure |
(2) | |
| Decline in agrochemicals’ sales by introducing regulations on the use volume of agrochemicals. | ・Develop environmentally friendly agrochemicals ・Develop biological agrochemicals ・Acquire biostimulant technologies ・Push ahead with registrations of agrochemicals in new countries |
(2) | |
| Reduction of the use volume and decline in sales of agrochemicals due to the expansion of organic beverage and food markets. | ・Develop environmentally friendly agrochemicals ・Develop biological agrochemicals ・Acquire biostimulant technologies ・Push ahead with registrations of agrochemicals in new countries |
(1)(2) | |
| Reduction of the use volume and decline in sales of agrochemicals by using various technologies, such as big data, drones, and farm management software. | ・Develop agrochemicals for drone spraying and promote their sales ・Push ahead with registrations of agrochemicals in new countries |
(1)(2) | |
| Increase in raw materials procurement costs due to water scarcity, floods, or similar risks in materials sourcing and processing and production of intermediate products; Supply shortage of those materials due to the suspension of or limitation to production. |
・Price pass-through to products ・Multiple sourcing of several key raw materials ・Switch the suppliers to those who use biomass-derived raw materials ・Develop products that use biomass-derived raw materials |
(2)(3) | |
High-impact Opportunities |
Rises in the ESG rating, the Group’s reputation, and the market capitalization through progressive approaches and information disclosure. | ・Enhance RC management ・Enhance initiatives for reducing environmental impacts ・Develop environmentally friendly agrochemicals and promote their sales ・Appropriate information disclosure |
(2) |
| Growth of demand for biological agrochemicals; increase in opportunities to develop new agrochemical products. | ・Develop environmentally friendly agrochemicals ・Develop biological agrochemicals ・Acquire biostimulant technologies ・Push ahead with registrations of agrochemicals in new countries |
(1)(2) | |
| Increase in sales of new agrochemicals that adapt to Smart Agriculture (such as drone agrochemicals spraying*) * It contributes to the reduction of the use volume of agrochemicals. |
・Develop agrochemicals for drone spraying and promote their sales ・Push ahead with registrations of agrochemicals in new countries |
(2) | |
| Increase in sales of agrochemicals* for agricultural products in countries and territories where farming lands are being expanded for food production due to population growth. (*Those products that contribute to the prevention of farmland expansion by improving yields and environmentally friendly.) | ・Promote sales of agrochemicals in developing countries where deforestation (farmland expansion) causes concern ・Develop environmentally friendly agrochemicals |
(1)(2) | |
| Increase in sales of low-carbon products by switching to biomass-derived raw materials | ・Switch the suppliers to those who use biomass-derived raw materials ・Develop products that use biomass-derived raw materials |
(2)(3) | |
| Increase in existing products’ sales and opportunities for the development of new agrochemicals due to the spread of pest insects, weeds, and pathogens and the development of their resistance. | ・Develop new agrochemicals ・Enhancing the agrochemicals portfolio ・Push ahead with registrations of agrochemicals in new countries |
(2)(3) | |
Metrics and Targets of Natural Capital (Update:August 2025)
For agricultural chemicals, the Kunming-Montreal Global Biodiversity Framework adopted in December 2022 set its global targets, including “reducing the overall risk from pesticides and highly hazardous chemicals by at least half (by 2030).” In addition, the Ministry of Agriculture, Forestry and Fisheries of Japan (MAFF) launched the “Strategy for Sustainable Food Systems, MIDORI,” under which MAFF aims to develop innovative technologies to realize a “50% reduction in risk-weighted use of agrochemicals.”
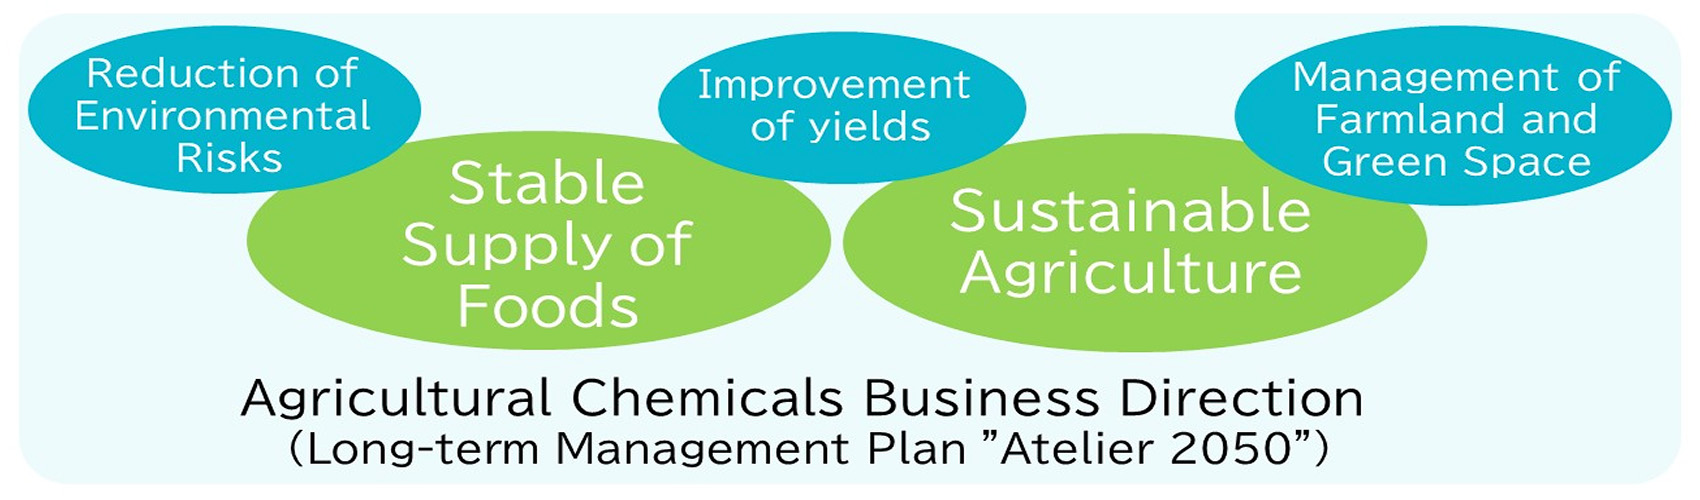
Although agricultural chemicals entail environmental risks, their appropriate use helps increase harvest efficiency and prevent deforestation caused by excessive farmland expansion. Furthermore, we will contribute to biodiversity conservation by properly managing and revitalizing abandoned farmland. Specifically, the “stable supply of food” and “sustainable agriculture” are clearly stated in the Group’s long-term management plan, “Atelier2050,” and the mid-term “Vista2027,” as future directions to pursue in the Agricultural Chemicals business. To achieve those goals, we need to tackle agricultural subjects, including “reduction of environmental risks,” “improvement of yields,” and “Management of Farmland and Green Space.”
Example Initiative (National Land Support in Hirakata City, Osaka Prefecture)
The National Land Support system promoted by the Ministry of Finance is an initiative that aims to contribute to the development of local communities by utilizing national land for the protection and preservation of the natural environment. Specifically, the initiative involves managing national land to protect the local natural environment, while also aiming to foster stronger engagement with local communities. We are participating in this system through our involvement in the management of national land in Hirakata City, Osaka Prefecture. The target area is about 3,800 m² of idle national land between government housing for public officials and a university, where uncontrolled weed growth had been an issue. In addition to conventional mechanical weeding, we demonstrated a more cost-effective and efficient management approach by using our own herbicide product. This initiative aims to serve as a model case for communities facing weed management challenges.
From a biodiversity perspective, we are also considering planting Eupatorium fortunei (fujibakama), a plant favored by the migratory butterfly Parantica sita (known as the chestnut tiger in Japan). This butterfly has also been observed at the biotopes established at our Toyama and Onoda plants, and fujibakama itself is designated as a near-threatened species. Through such activities, we aim to contribute to the preservation of local ecosystems and the conservation of biodiversity.
Metrics, Mid-term and Long-term Targets
Under the long-term management plan “Atelier 2050” and the mid-term management plan “Vista 2027,” we currently have the following mid-term and long-term goals for reducing environmental risks.
| Category | Metrics | Scope | Target for FY2027 | Target for FY2050 |
|---|---|---|---|---|
| GHG emissions | Scope1+2 (Absolute Emissions) |
Non-consolidated | Reduce emissions by at least 30% from the FY2018 level | Carbon neutrality |
| Waste | Industrial waste and pollutant emissions for final disposal | Non-consolidated | Final disposal volume:Reduce by 50% compared to FY2021 | ― |
We will disclose other indicators in the future, referring to the core disclosure indicators related to dependence/impact and risk/opportunity recommended in the TNFD Framework. In addition, we will work to reduce our environmental impact.
| Indicator | Scope | Unit | FY2022 | FY2023 | FY2024 | |
|---|---|---|---|---|---|---|
| GHG emissions (Scope1+2) | Non-consolidated | t-CO2e | 327,663 | 285,320 | 277,912 | |
| Total spatial footprint | Total surface area controlled/managed by the organization | ※2 | m2 | 1,171,692 | 1,171,692 | 1,171,692 |
| Total disturbed area | ※2 | m2 | 1,171,692 | 1,171,692 | 1,171,692 | |
| Total rehabilitated/restored area | ※2 | m2 | 137,264 | 137,264 | 137,264 | |
| Extent of use change | Extent of land/freshwater/marine ecosystem use change | ※2 | m2 | 0 | 0 | 0 |
| Extent of land/freshwater/marine ecosystem conserved or restored※1 | ※2 | m2 | 472 | 800 | 136 | |
| Soil Pollutants(PRTR Substances) | Non-consolidated | ton | 0 | 0 | 0 | |
| Water pollution | Effluent※3 | Non-consolidated | 1000m3 | 37,463 | 35,656 | 37,010 |
| COD | Non-consolidated | ton | 259 | 139 | 160 | |
| Total phosphorus emissions | Non-consolidated | ton | 13 | 7 | 19 | |
| Total nitrogen emissions | Non-consolidated | ton | 2,413 | 1,686 | 2,596 | |
| PRTR Substances | Non-consolidated | ton | 0.4 | 0.4 | 0.14 | |
| Effluent temperature | Non-consolidated | ℃ | Remain in a water reservoir for several days and drain at the same level as the outside temperature. | |||
| Waste | Volume of industrial waste | Non-consolidated | ton | 32,489 | 24,563 | 26,195 |
| Volume of specially controlled industrial waste | Non-consolidated | ton | 6,717 | 5,971 | 7,083 | |
| Incineration | Non-consolidated | ton | 10,113 | 8,510 | 10,412 | |
| Landfill disposal | Non-consolidated | ton | 626 | 488 | 494 | |
| Waste otherwise disposed※4 | Non-consolidated | ton | 15,710 | 9,970 | 9,437 | |
| Waste with unknown disposal method | Non-consolidated | ton | 0 | 0 | 0 | |
| Recycled volume | Non-consolidated | ton | 6,040 | 5,595 | 5,853 | |
| Atmospheric pollution | Volatile organic compounds (VOCs) | Non-consolidated | ton | 0.5 | 0.3 | 3.5 |
| NOx | Non-consolidated | ton | 96 | 63 | 72 | |
| SOx | Non-consolidated | ton | 19 | 23 | 29 | |
| Dust | Non-consolidated | ton | 7 | 8 | 10 | |
| PRTR Substances | Non-consolidated | ton | 0.5 | 2.7 | 3.5 | |
| Compliance Violation※5 | Non-consolidated | Cases | 0 | 0 | 0 | |
| Hazardous waste recycling during production | Non-consolidated | % | 0 | 0 | 0 | |
| Hazardous waste recycling at end of-life | Non-consolidated | % | 0 | 0 | 0 | |
- 1 Percentage change from the previous year
- 2 Nissan Chemical and its consolidated subsidiaries related to agrochemical production(NC Agro Hakodate Corporation, Nissan Bharat Rasayan PVT. LTD.)
- 3 Water returned to the source of extraction at similar or higher quality as raw water extracted
- 4 Industrial waste: Neutralization, crushing, dehydration, mechanical drying, etc.
Specially controlled industrial waste: Neutralization, oil-water separation, dehydration, etc. - 5 Significant Violations to environmental laws and regulations
| Indicator | Scope | Unit | FY2022 | FY2023 | FY2024 |
|---|---|---|---|---|---|
| Fines or penalties related to violations to environmental laws and regulations | Consolidated | Yen | 0 | 0 | 0 |