


Sustainability
Sustainability
- HOME >
- Sustainability >
- Sustainability >
- Information Disclosure in Line with TCFD and TNFD Recommendations
Information Disclosure in Line with TCFD and TNFD Recommendations
Strategy of Climate Change (Update:July 2025)
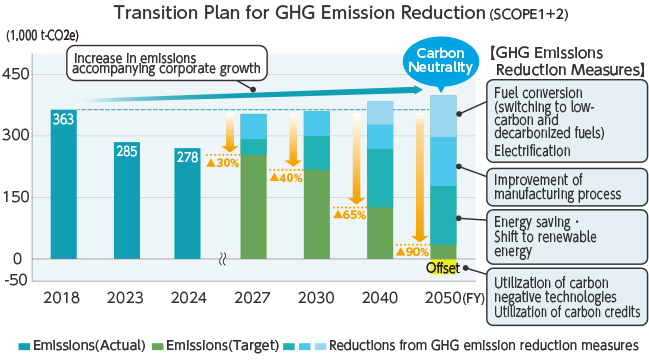
Transition Plan for GHG Emission Reduction
We have positioned "climate change mitigation" as one of the materiality elements and formulated the GHG emissions reduction plan in FY2024, aiming to achieve carbon neutrality (Scope 1 and 2) by 2050.
To achieve our FY2027 target of “Reduce emissions by at least 30% from the FY2018 level”, we are advancing initiatives such as improvement of manufacturing process (reduction of N2O emissions from nitric acid plants) and expansion of renewable electricity introduction, in addition to reductions already achieved through the boiler fuel conversion at Onoda Plant and the shutdown of melamine production.
Beyond FY2027, we aim to achieve carbon neutrality by 2050 through initiatives such as expansion of renewable electricity introduction, fuel conversion (switching to low-carbon and decarbonized fuels), improvement of manufacturing processes, and utilization of carbon negative technologies.
GHG Emissions Reduction Measures
| Vista2027(FY2022~FY2027) | ~2040 | ~2050 |
|---|---|---|
| ・Melamine production shutdown (implemented in FY2022) ・Boiler fuel conversion at Onoda plant (implemented inFY2022) ・Expansion of renewable energy introduction (non-fossil certificate, PPA) ・Promotion of energy saving ・Improvement of manufacturing process (reduction of N2O emissions from nitric acid plants) |
・Expansion of renewable energy introduction (non-fossil certificate, PPA) ・Promotion of energy saving ・Fuel conversion (switching to low-carbon and decarbonized fuels) and electrification, etc. |
・Expansion of renewable energy introduction (non-fossil certificate, PPA) ・Promotion of energy saving ・Fuel conversion (switching to low-carbon and decarbonized fuels) ・Improvement of manufacturing processes ・Utilization of carbon negative technologies ・Utilization of carbon credits |
Scenario Analysis
TCFD Recommendations require companies to conduct a scenario analysis to understand how the risks and opportunities arising from climate change affect their finances. Scenario analysis is a method to project the degradation of the natural environment, such as climate change, water scarcity, as well as changes or shifting of the business environment due to long-term policy trends regarding climate change and to examine how those changes may influence the corporate’s business and operation.
In 2020, we developed the 2°C scenario in which the transition to a decarbonized society would be realized (the transition risks would be evident) and the 4°C scenarios in which climate change would progress (the physical risks would be evident). Based on those scenarios, we identified business risks and opportunities, examined their importance, and mapped out their effects on the Company and our strategies. However, at the Conference of the Parties to the United Nations Framework Convention on Climate Change (COP26) held in 2021, it was agreed to pursue efforts to limit the rise in average temperature to 1.5°C; accordingly, we revised our scenario analysis in July 2023.
Referenced Scenarios
| 1.5°C Scenario*1 | 4°C Scenario*2 |
|---|---|
| ・IEA-WEO*3, ETP*4 Net Zero Scenario (NZE) ・IPCC SSP*5 1-1.9, 1-2.6 |
・IEA-WEO Stated Policies Scenario (STEPS) ・IPCC SSP5-8.5 |
- *1The scenario where necessary measures are implemented to keep the increase in global average temperature below 1.5°C above pre-industrial levels.
- *2The scenario where the global average temperature increases by 4°C above the pre-industrial levels at the end of the 21st century.
- *3International Energy Agency “World Energy Outlook” (2022)
- *4International Energy Agency “Energy Technology Perspectives” (2023)
- *5Intergovernmental Panel on Climate Change (IPCC) “Shared Socio-economic Pathway”
Scope and Period of Analysis
- ●Scope of Analysis:
Chemicals business, Performance Materials business, Agricultural Chemicals business, Healthcare Business, Planning and Development Division - ●Period of Analysis:2030 and 2050
Process of Risks and Opportunities Identification
| Step1 | Clarify the value chain (VC) and stakeholders and sort out factors influencing our business. |
| Step2 | Identify risks and opportunities based on the above scenarios and other external information. |
| Step3 | Select particularly important risks and opportunities from Step 2, considering the probability of occurrence and the impact on our business (human loss, financial impact, etc.) |
Climate Change Risks and Opportunities, and Main Measures
| Scenario | Factors | Value Chain | Impact on Business | Relevant Business | Main Measures | |
|---|---|---|---|---|---|---|
| 1.5℃ Scenario |
Regulations on GHG emissions | Upstream | Risk | ・Increase in raw material procurement costs due to introduction of carbon pricing such as carbon taxes, and compliance with regulations and decarbonization investment, by suppliers | All | ・Price pass-through to products ・Multiple sourcing of several key raw materials |
| Direct Operations | ・Increase in operating costs due to introduction of carbon pricing such as carbon taxes, and compliance with regulations and decarbonization investments | ・Fuel and feedstock conversion at plants ・Update to energy-saving equipment, etc. ・Increased use of renewable energy ・Zero emissions of N2O from nitric acid production capacity (Planned investment amount:830 million yen) ・Optimization of the manufacturing process ・Promotion of decarbonized investment by introducing internal carbon pricing |
||||
| Opportunity | ・Avoid the impact of carbon pricing by reducing GHG emissions | |||||
| ・Changes in energy policy ・Changes in energy demand and supply |
Upstream | Risk | ・Increase in raw material procurement costs due to renewable energy procurement by suppliers | All | ・Price pass-through to products ・Multiple sourcing of several key raw materials |
|
| ・Increase in logistics costs | ・Optimization of transportation routes, systems, etc. | |||||
| Direct Operations | ・Increase in operating costs due to in-house renewable energy procurement | ・Update to energy-saving equipment, etc. ・Optimization of the manufacturing process |
||||
| Opportunity | ・Reduce operating costs by improving energy efficiency and saving energy. | |||||
| ・Acquiring opportunities for funding (subsidies, etc.) | ・Advanced GHG emission reduction efforts and appropriate information disclosure | |||||
| Market changes due to increasing demand for environmental consideration | Downstream | Risk | ・Decrease in sales of agricultural chemicals business due to the introduction of regulations on the use of agrochemicals | Agri | ・Development of environmentally friendly agrochemicals ・Development of biological agrochemicals ・Acquiring of biostimulant technology ・Push ahead with registrations of agrochemicals in new countries. |
|
| Opportunity | ・Increase in demand for biological agrochemicals, etc. | |||||
| Risk | ・Decrease in sales due to inability to provide low-carbon products ・Decrease in demand from customers due to the retention of products and businesses with large GHG emissions |
All | ・Expand sales of low-carbon products ・Development of environmentally friendly products and services ・Establishment of innovative manufacturing technologies ・Review of the business portfolio ・Promotion of decarbonized investment by introducing internal carbon pricing ・Increased use of renewable energy ・Fuel and feedstock conversion at plants |
|||
| Opportunity | ・Increase in demand and sales of parts and materials for low-carbon products | |||||
| Increased demand from investors and others for addressing climate change | Direct Operations | Risk | ・Damages of ESG evaluation and reputation, decrease in market capitalization, and financing difficulties due to delay in measures to climate change, such as heavy use of fossil fuels | All | ・Further advanced GHG emission reduction efforts ・Appropriate information disclosure |
|
| Opportunity | ・Improve ESG evaluation and reputation, and increase market capitalization through advanced initiatives and information disclosure | |||||
| 4℃ Scenario |
Rising temperatures・Increase in abnormal weather | Direct Operations | Risk | ・Increase in risk of impacts on plant operations, equipment, inventory, and supply chains due to flooding caused by heavy rains, floods, and rising sea levels | All | ・Formulate BCP (business continuity plan) for key products in each plant. ・Rase the foundation of the plant buildings, and place equipment and other key items on the high floor, depending on risk |
| ・Reduced production capacity (such as insufficient cooling capacity, etc.) and increased product and material management costs, due to water shortages caused by droughts and heat waves | ・Formulate BCP (business continuity plan) for key products in each plant. ・Optimization of the existing cooling system ・Introduce equipment for water-saving and water-recycling ・Introduce energy-saving air conditioning and cooling equipment |
|||||
| Market changes caused by rising temperature and abnormal weather | Downstream | Risk | ・Reduction of planted area due to increase in frequency and intensity of storms/floods and difficulties in securing irrigation water. ・Changes in the distribution of planting and reduction in planted area due to temperature rise. |
Agri | ・Push ahead with registrations of agrochemicals in new countries. ・Enhancing our agrochemicals portfolio |
|
| Opportunity | ・Increase in sales of existing agrochemicals and in opportunity to develop new agrochemicals due to the increase of pest, weed, and pathogen and the resistance expression | ・Develop new agrochemicals ・Enhancing our agrochemicals portfolio ・Push ahead with registrations of agrochemicals in new countries |
||||
| ・Increase in disinfectants’ sales due to the reduction of usable (fresh) water resources and the growth of global demand for drinking water | Chem | ・Expand sales of disinfectants for drinking water | ||||
All: All business・Planning and Development Division, Agri: Agricultural Chemicals business, Chem: Chemicals business
Major Financial Impacts
| Scenario | Calculation Method | Impact (# 2027) |
||
|---|---|---|---|---|
| 1.5°C Scenario |
Risk | Increase in operating costs due to introduction of carbon pricing such as carbon taxes, and compliance with regulations and decarbonization investments | Calculation of the increase in operating costs in 2030 due to the introduction of carbon pricing from estimated emissions and carbon price ※Assumed the cases in which emissions reduction does not progress compared to the base year (FY2018) results ※Carbon price (2030):140$/t-CO2 Referred to IEA WEO2022 NZE |
5.9 billion yen / year |
| Increase in operating costs due to in-house renewable energy procurement | Calculated the amount of operating costs increase for procurement of renewable energy power in 2030, based on the sales plan for 2027, if all electricity used is switched to renewable energy power ※Estimated renewable energy power procurement unit price refer to the non-fossil certificate price, etc. |
0.46 billion yen / year | ||
| Decrease in sales of agricultural chemicals business due to the introduction of regulations on the use of agrochemicals | Calculated the amount of sales decrease in 2030 due to regulations of Agrochemicals such as the Green Food System strategies | 2.3 billion yen / year | ||
| Decrease in sales due to inability to provide low-carbon products | Calculation of the sales decrease in 2030 where decarbonization in the company’s chemical manufacturing process does not progress, and sales volume of existing products with high product life cycle emissions (product carbon footprint) decreases ※Sales of existing products are actual figures for 2021 ※Forecasted decrease in sales volume of existing products is estimated by referring to IEA Net Zero by 2050, etc. |
4.2 billion yen / year | ||
| Opportunity | Avoid the impact of carbon pricing by reducing GHG emissions | Calculated the amount of avoidable increase in operating costs in 2030 due to introduction of carbon pricing, if the FY2027 target (reducing by at least 30% from FY2018 level) is achieved ※Carbon price (2030):140$/t-CO2 Referred to IEA WEO2022 NZE |
1.8 billion yen / year | |
| Increase in demand and sales of parts and materials for low-carbon products | For low-carbon products that demand is expected to increase, calculation of sales increase from FY2021 based on formulated sales plan for FY2027. | # 1.2 billion yen / year | ||
| 4°C Scenario |
Risk | Increase in risk of impacts on plant operations, equipment, inventory, and supply chains due to flooding caused by heavy rains, floods, and rising sea levels | Calculation of decreased sales and damage to equipment and inventory during the period when production sites, which have a particularly large impact, have ceased operations as the financial impact in the event that a site is flooded, based on 2030 and 2050 assumptions. ※Aqueduct floods used to analyze flood depth ※Damage rate due to flooding is set with reference to Manual for Economic Evaluation of Flood Control Investment (Draft), etc. published by the Ministry of Land, Infrastructure, Transport and Tourism. ※The amount of financial impact is calculated as the maximum risk where floods occur at a site with a large impact and no countermeasures taken, based on FY2021 site sales, equipment and inventory levels, etc. |
FY2030: 7.6 billion yen / year FY2050: 12.8 billion yen / year |
Summary of Scenario Analysis
As a result of scenario analysis and quantifying the financial impact using the 1.5°C scenario, we identified important risks, such as increased operating costs with the introduction of carbon pricing and decreased sales from an inability to provide low-carbon products. In response to the introduction of carbon pricing and decrease in demand for products with high life-cycle carbon emissions, we will work to reduce the risks by not only further promoting the use of renewable energy and conversion of fuel and feedstock at our plants, something which we have been working on thus far, but also by further promoting decarbonization investments that take into account reducing GHG emissions through the use of internal carbon pricing.
And in response to market changes due to increasing demand for environmental considerations, we assume that demand for environmentally friendly biological agrochemicals and low-carbon products, such as materials for secondary battery, will increase. In terms of biological agrochemicals, we established the Biological Group within Agricultural Chemicals Research & Development Department, Biological Research Laboratories in April 2022 and conduct R&D toward commercialization. Additionally, in the Environment & Energy field, we aim to commercialize the secondary battery materials, the energy harvesting materials, and CCS/CCUS materials, by accelerating the development of them.
Meanwhile, regarding the risk of flood damage, which we recognize as a risk in the 4°C scenario, we have identified the possibility of flooding at our major production and distribution bases as a material risk. To address this risk, we will continue to formulate and revise the BCPs for our plants and major products from time to time, raise the floors and foundations of our plant equipment, secure product inventory, and purchase multiple sourcing of key raw materials.
And in response to market changes owing to rising temperatures and abnormal weather, we assume that demand for agricultural chemicals and disinfectants for drinking water will increase due to the increase in pests and weeds, as well as water shortages and spread of infectious diseases. Based on the prospect of market growth, we aim to expand our opportunities. Furthermore, by building a business portfolio that is less susceptible to the effects of climate change, we will increase the resilience of our business activities and strive to minimize risks and maximize opportunities.
Metrics and Targets of Climate Change (Update:August 2025)
To mitigate climate-related risks across our group, we recognize that reducing the Company’s emissions, which account for approximately 90% of the Group-wide GHG (Scope 1 and 2) emissions, is of critical importance. For this reason, we set “achieving carbon neutrality by 2050” in the long-term and “reducing GHG emissions by at least 30% from FY2018 level by FY2027” in the mid-term to cut down the Company’s GHG emissions (Scope 1 + 2). Those targets are included in the Group’s non-financial targets in the long-term business plan “Atelier2050,” and the mid-term “Vista2027,” and the progress of those initiatives is being checked and managed. In addition, the degree of attainment of those reduction targets is reflected in the ESG-linked portion of our officers’ performance-related remuneration.
Mid-term and Long-term Targets
| Category | Metrics | Scope | Target for FY2027 | Target for FY2050 | |
|---|---|---|---|---|---|
| GHG emissions | Scope1 + 2 | Absolute Emissions | Non-consolidated | Reduce emissions by at least 30% from the FY2018 level | Carbon neutrality |
Since FY 2018, we have been steadily reducing GHG emissions by terminating melamine production, converting boiler fuel at the Onoda Plant, and saving energy by upgrading aging facilities.
In FY2024, emissions decreased compared to FY2023 due to the expansion of the renewable energy adoption rate and the operation of the solar-power generation system at the Materials Research Laboratories.
The Company’s GHG emissions and energy consumption have been subject to third-party verification since FY2018. We will continue to advance our approaches to reduce emissions and environmental impact and strive to disclose highly reliable information.
| Scope | Unit | FY2018 | FY2021 | FY2022 | FY2023 | FY2024 | Target (Target year) |
|
|---|---|---|---|---|---|---|---|---|
| Scope1 | Non-consolidated | t-CO2e | 245,469 | 231,713 | 223,388 | 174,133 | 166,980 | - |
| Scope2 | Non-consolidated | t-CO2e | 117,926 | 113,623 | 104,275 | 111,187 | 110,932 | - |
| Scope1+2 | Non-consolidated | t-CO2e | 363,395 | 345,336 | 327,663 | 285,320 | 277,912 | 254,377 (2027) |
| GHG Emission rate per unit to sales※1 (Scope1+2) |
Non-consolidated | t-CO2e/ million yen |
2.33 | 2.03 | 1.79 | 1.58 | 1.38 | - |
| Scope3※2 | Non-consolidated | t-CO2e | 703,562 | 803,461 | 885,046 | 927,262 | 939,244 | - |
| Energy consumption rate※3 | Non-consolidated | ※4 | 82.8 | 81.5 | 63.3 | 62.0 | 55.6 | - |
| Scope1 | Consolidated※5 | t-CO2e | 253,785 | 238,958 | 230,424 | 180,409 | 184,280 | - |
| Scope2 | Consolidated※5 | t-CO2e | 128,647 | 124,663 | 115,893 | 124,730 | 131,089 | - |
| Scope1+2※6 | Consolidated※5 | t-CO2e | 382,432 | 363,621 | 346,316 | 305,138 | 315,369 | - |
| Non-consolidated / Consolidated (Scope1 + 2) |
% | 95.0 | 95.0 | 94.6 | 93.5 | 88.1 | - |
- 1 Amount of emissions (t-CO2e) / Non-consolidated sales (million yen)
- 2 Data of each category: https://www.nissanchem.co.jp/eng/csr_info/index/esg_data.html
- 3 Energy consumption / non-consolidated sales
- 4 FY2013 as a base of 100
- 5 Nissan Chemical Corporation and consolidated subsidiaries with manufacturing facilities. (Nihon Hiryo Co., Ltd., Nissan Chemical America Corporation, NCK Co., Ltd.)
- 6 Due to rounding off figures, some of the above scope1 and scope2 sums do not match